The ultimate objective of this activity is Completion, the extent to which all desired characteristics of the digital thread have been realized. As a metric, Completion is strongly correlated with project Schedule, but it is also an indicator of project Risk. Completed segments of the digital thread represent a reduced technical risk of unexpected problems threatening the project's viability.
Given the nature of a federated system model, this has two aspects:
- Completeness within the individual repositories
- Completeness of the inter-model connections between repositories
The second category may be queried directly from the Syndeia graph database, but the first requires queries directly to the underlying repositories. Syndeia provides specialized endpoints to do this for our many integrations through a single interface, the Syndeia Cloud REST API. Our metrics here in Part 5 include multiple examples of this, generally based on Jama Connect requirements but readily applicable to our other integrations.
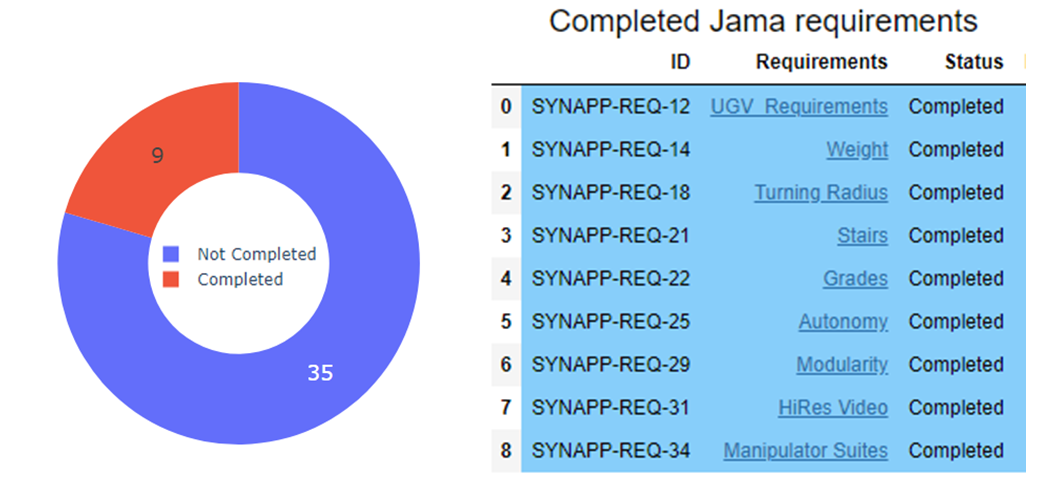
Requirements in Jama Connect may have a Status attribute (Draft, Completed, Approved, etc.). If our objective is to measure how many requirements out of a particular set of requirements have their attribute status set to “Completed”, our query must go to the Jama repository because Status is not part of the metadata Syndeia Cloud stores about Jama artifacts.
But we must first establish what requirements are in the set to be queried. Syndeia Cloud cannot tell us this; it is only aware of requirements that have inter-model connections to other repositories in the Syndeia graph. There may be other relevant requirements that are not yet part of this digital thread. The first task is to identify all the requirements in a particular group. Our Jupyter notebook contains a recursive algorithm that creates a flat list of all requirements, with their attributes, derived from a hierarchy of elements headed by a specific requirement or other artifact. Once the list has been generated, it can be sorted and counted by simple Python statements and the results are shown in Figure 1. A pie chart shows the number of Completed and Non-Completed requirements in the set and a separate list of Completed requirements is shown for additional information.
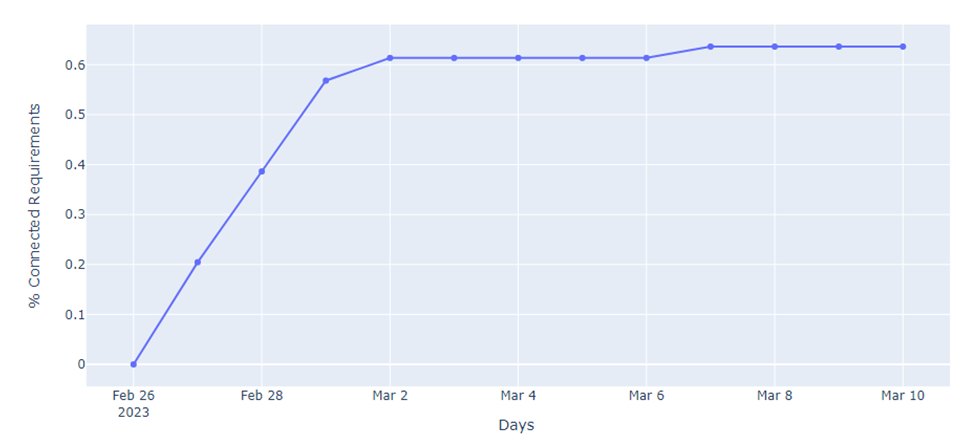 Figure 2 Percentage of Requirements Connected to Digital
Once a set of requirements has been specified within the Jama repository, a second measure of completion is the measure of the percentage of those that have been made part of our digital thread, the Syndeia Project UGV02. Unlike the Figure 1 metric, this is based on queries to the Syndeia graph database, after the set of relevant requirements (and their number) has been identified by queries to the Jama repository. Figure 2 calculates the cumulative percentage of relevant requirements brought into the UGV02 digital thread over a two week project.
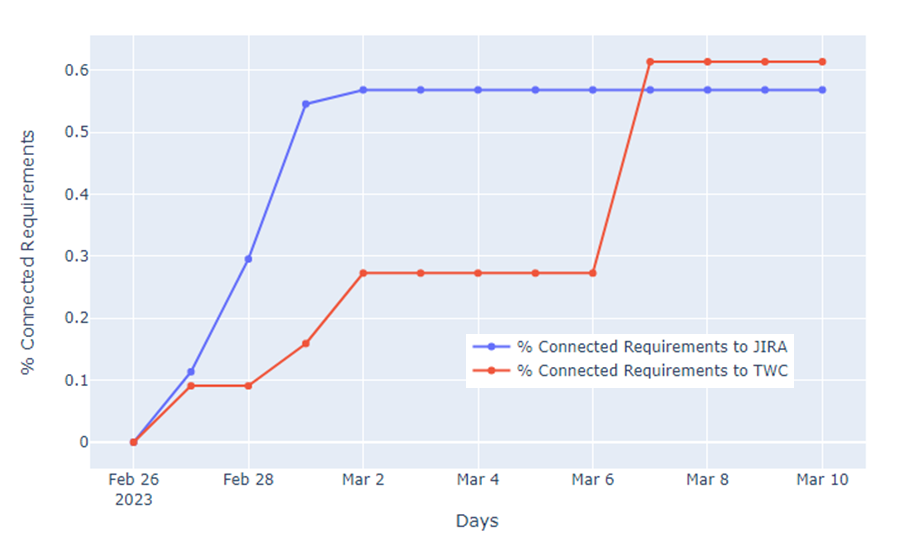 Figure 3 Percentage of Requirements Connected to Digital
The completion factor in Figure 2 is complicated by situations where the requirement may need to be connected to two or more different repositories. Figure 2 only requires that it be connected at least once, but our digital thread schema shown in Part 2 indicates that a requirement may be connected twice. A connection may be made to a JIRA issue, which is used to log progress on meeting the requirement, and a connection may be made to a SysML block or activity on Teamwork Cloud (TWC) that is proposed to satisfy the requirement. Figure 3 has a similar analysis to Figure 2, but we break down the connections by whether the connection from the requirement ends in JIRA or TWC.
Not surprisingly, we see that connections to JIRA rise quickly early in the project as we set up the logging function for project management, while connection to TWC lags until the architectural model has been more fully detailed. They ultimately trend to the same percentage shown in Figure 2, suggesting that most of the same requirements are now doubly connected. It would be straightforward to add additional queries to list which requirements are not connected to the digital thread for further investigation.
The metrics shown here in Part 5 are based on queries to the Syndeia Cloud graph and to the Jama repository, all via the Syndeia Cloud REST API. Similar metrics for JIRA, TWC and any of the other repositories in the digital thread could be added to the Jupyter notebook with almost identical code. The power to view the entire digital thread through “a single pane of glass” is one of the most important benefits of the Syndeia digital thread platform.
In Part 6, we address Consistency, a measure of the continuing change of elements in the digital thread.
For more blogs in the series:
- Critical Metrics for Digital Threads, Part 1
- Critical Metrics for Digital Threads, Part 2
- Critical Metrics for Digital Threads, Part 3
- Critical Metrics for Digital Threads, Part 4
- Critical Metrics for Digital Threads, Part 5 (This Part)
- Critical Metrics for Digital Threads, Part 6
- Critical Metrics for Digital Threads, Part 7
- Critical Metrics for Digital Threads, Part 8
- Critical Metrics for Digital Threads, Part 9