While Complexity may be a confusing concept, Activity has clearer correlations with cost and schedule. In this post, I will illustrate some of the ways in which systems engineering activity can be calculated and displayed using Syndeia to query the digital thread for our UGV02 project.
 Figure 1 Syndeia Inter-Model Relations Creation Timeline
Figure 1 displays the number of inter-model relations created each day over a two-week period, February 26 to March 10, 2023. This was generated in a Jupyter notebook by making a series of graph query calls to the Syndeia Cloud REST API and plotting the results using the plotly.graph_objects visualization library. Each call requests the Syndeia inter-model relations within the UGV02 Syndeia project with a Modification Date (part of the metadata the Syndeia graph saves for each relation) on a particular date. These calls are made retrospectively from a single time point.
We assume that this is a proxy for the level of systems engineering effort expended per day and, therefore, systems engineering cost. The results could be further filtered by individual Syndeia users, also captured in the graph relations metadata. The creation of new inter-model relations is only one part of an SE’s responsibilities and only represents digital thread activity, not activity within the underlying model repositories, e.g., the SysML model. However, additional data from Syndeia, for example, activity adding elements within the repositories or updating relations as models change is also available via the Syndeia Cloud REST API and could be added to the analysis.
 Figure 2 Cumulative Number of Relations against Plan
Figure 2 plots the relations generated cumulatively vs. plan, providing an indicator of whether the project is on schedule.
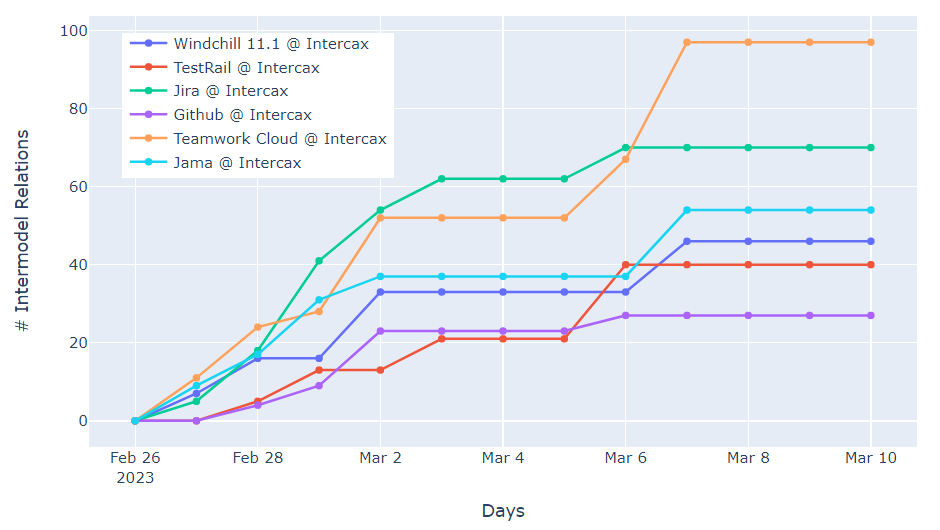 Figure 3 Cumulative Inter-Model Relations by Repository
Figure 3 again displays the number of inter-model relations cumulatively, but in this case, broken down by repository. An inter-model connection is counted toward a particular repository if either of its ends is in that repository, so the total number of relations is double-counted. We can see that different repositories show different levels of activity at different stages of the project. Requirements in Jama are actively added to the thread at the beginning; tests recorded in TestRail more so toward the end. Other repositories, such as Teamwork Cloud and JIRA remain active continuously through the project.
All of the metrics illustrated in this post depend on graph queries made to the Syndeia Cloud database and reflect the high-level structure of the digital thread. But Syndeia also gives us ways to monitor activity at the individual repository level by providing endpoints to query Jama, Teamwork Cloud, JIRA, etc., e.g. how many requirements, SysML elements or issues have been added to the project. In the next three posts, we will show examples of metrics generated using some of this data.
For more blogs in the series:
- Critical Metrics for Digital Threads, Part 1
- Critical Metrics for Digital Threads, Part 2
- Critical Metrics for Digital Threads, Part 3
- Critical Metrics for Digital Threads, Part 4 (This Part)
- Critical Metrics for Digital Threads, Part 5
- Critical Metrics for Digital Threads, Part 6
- Critical Metrics for Digital Threads, Part 7
- Critical Metrics for Digital Threads, Part 8
- Critical Metrics for Digital Threads, Part 9