In Parts 3 through 7 of this blog series, we have examined critical metrics associated with the digital thread and their relations with project metrics such as cost, schedule and risk. We illustrated these with specific queries executed through the Syndeia digital thread platform, captured as a script in a Jupyter notebook.
These metrics have the greatest value when they can be tracked over time, i.e., measured repetitively, which suggests the need for automation. For example, the notebook could be run each morning at 7 am, and the results available for the project team members as they begin their workday. We must also consider the time it takes to complete the notebook execution each time. The notebook used in our examples makes several hundred individual queries to Syndeia Cloud and, through it, to the underlying model repositories. The time for each query depends on how optimized the query is, the speed of the network connections, and the response time of the repository APIs. Even though individual queries can be very fast, the full notebook execution can take several minutes or longer and may be best carried out asynchronously.
Syndeia’s approach to automation is inclusive, with the ability to use third-party and open-source digital pipeline tools in addition to any automation interfaces provided by Intercax. This gives users flexibility in applying tools that may already be familiar as part of their DevOps software engineering environment. In this post, we will discuss an approach we have set up in our own organization using GitHub Actions, part of our regular software development toolset, and NBViewer, a web-based free tool for viewing the notebook execution results.
We have published extensively on using Jupyter notebooks to demonstrate analysis and visualization of digital threads using the Syndeia Cloud REST API. This open-source development platform provides a wealth of data analysis and plotting libraries in Python, enabling efficient interactive testing and editing of custom scripts. The first step in our automation process is to develop and debug a notebook manually, in this case, our critical metrics analysis.
We have created a repository in GitHub, a cloud-based service for software development and version control we use widely inside our organization. We have created folders labeled Notebooks and Results inside it, as shown in Figure 1. Notebooks that we wish to be run automatically are committed to the Notebooks folder.
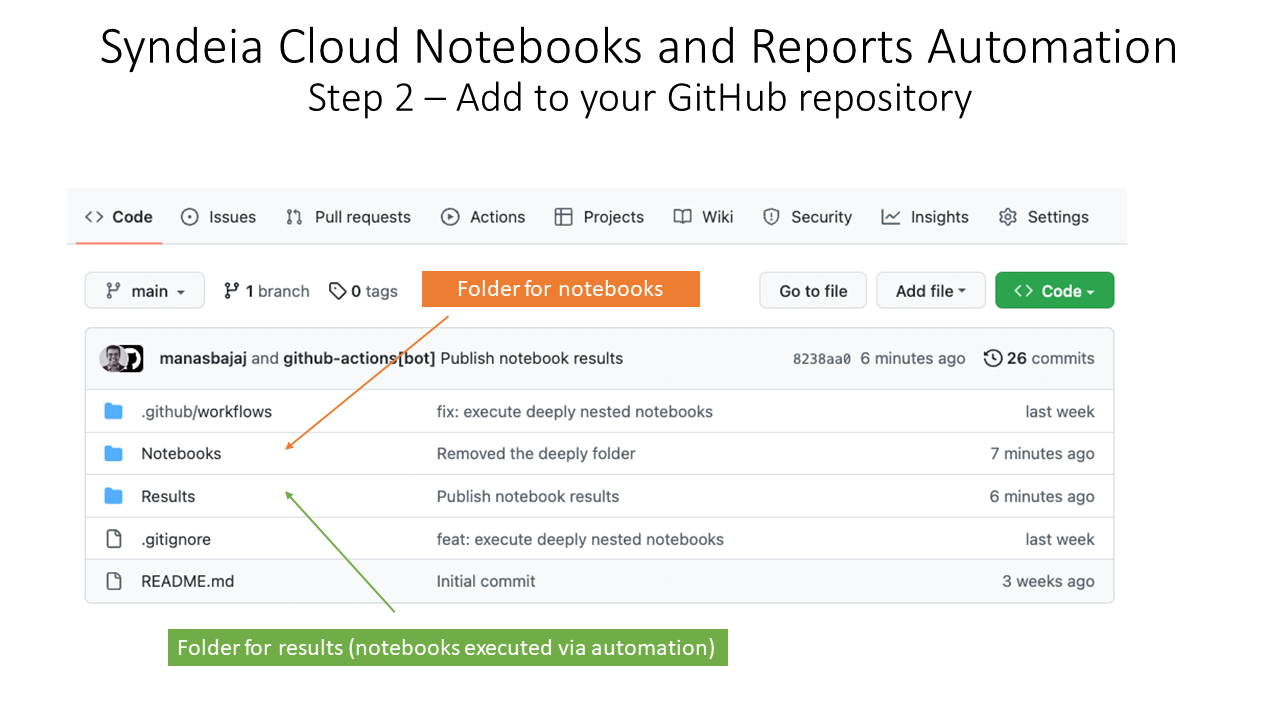 Figure 1 GitHub Repository organized by Notebooks and Results
We have also created a workflow inside this repository that executes all the notebooks in the Notebooks folder using GitHub Actions, a feature providing DevOps capabilities to GitHub. This workflow can be activated by any of several triggers as the user wishes, including a standard time interval or committing a new version of one of the notebooks in the Notebooks folder. In Figure 2, we show several of the workflow runs. The results of the run are saved to a time-stamped folder in the Results folder.
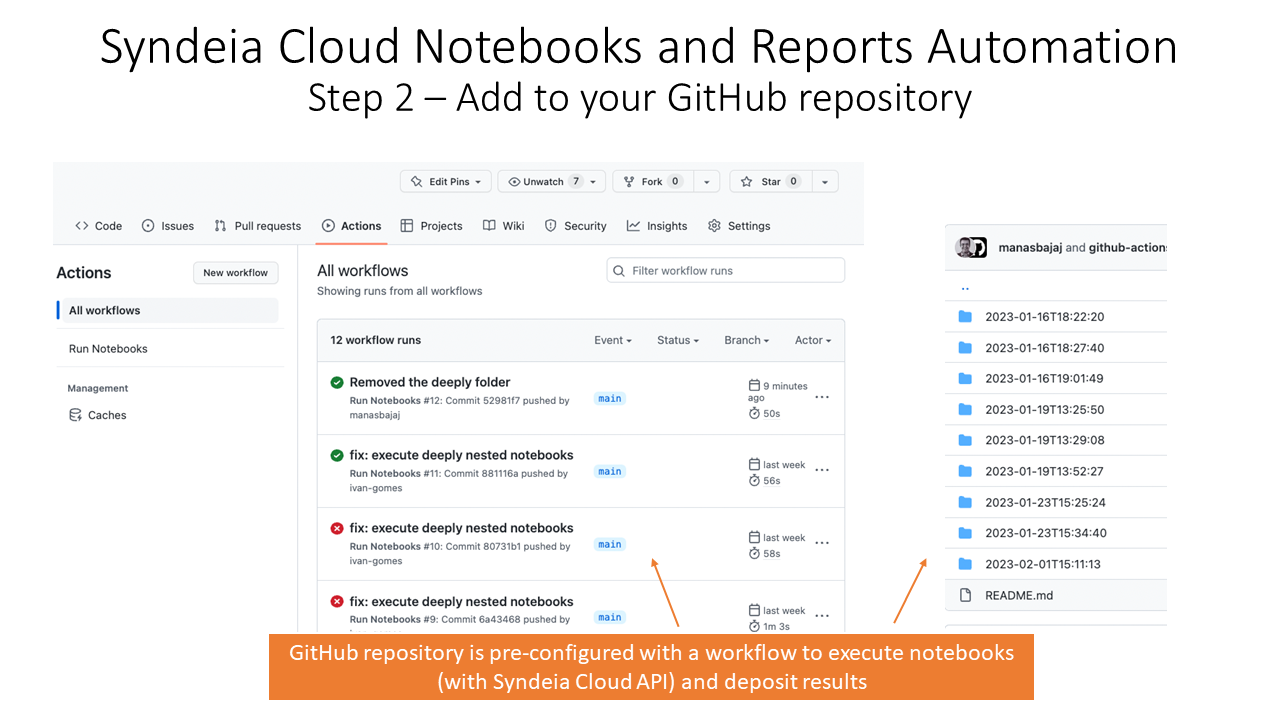 Figure 2 GitHub Actions dashboard showing notebook execution runs
The notebooks can be viewed in GitHub itself or by other interfaces. In our organization, we use NBViewer, a web-based tool that allows the results to be viewed on a standard web browser. In Figure 3, we show an excerpt from a specific run of the critical metrics notebook showing requirements status with respect to test for a specific digital thread project. The python code shown in the gray area at the top generates the pie chart using the Plotly graphing library that is part of the Jupyter package. The data itself was generated in a previous notebook cell.
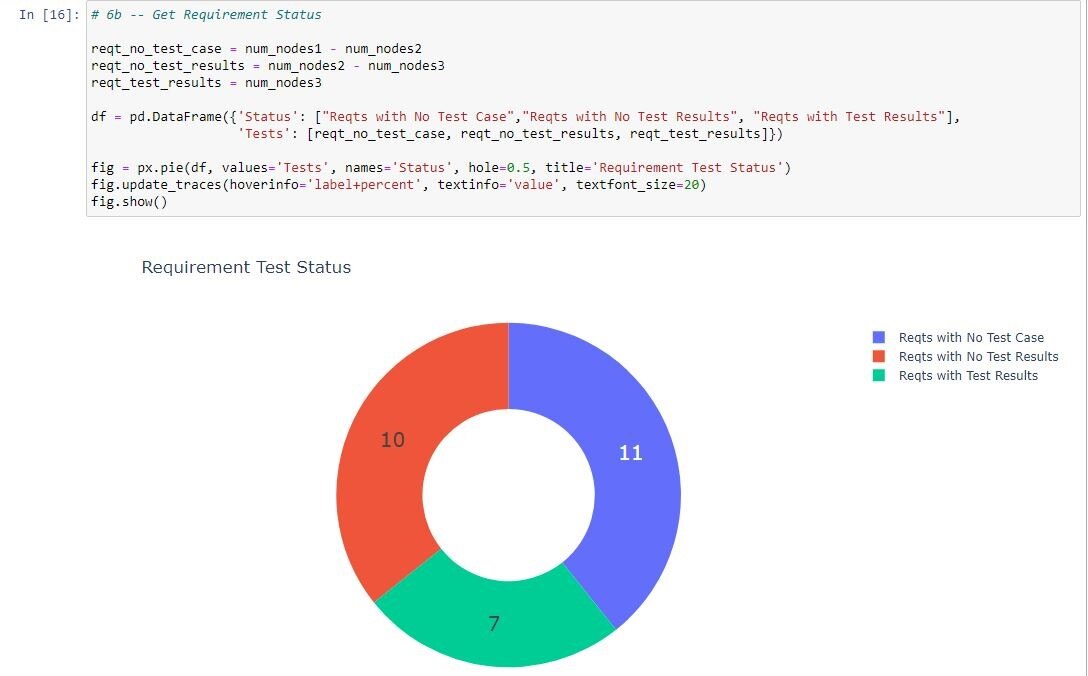 Figure 3 Excerpt from Critical Metrics Notebook Run July 19, 2023
An important question of data security is raised by this exercise. In order for the Critical Metrics notebook to access data from each of the repositories involved, including Jama, JIRA, Windchill, etc., as well as Syndeia Cloud, Syndeia must have accounts with (at minimum) read permissions for each of those repositories. A separate Syndeia user account can be set up for each repository and the user credentials can be saved in encrypted form in the notebook, allowing Syndeia access to all the required raw data. The summary metrics in the notebook results, however, can be shared even with users who do not have access to the raw data.
In the final post in this series, we will summarize our early findings in this investigation and look at how these ideas will be realized in upcoming Syndeia releases.
For more blogs in the series:
- Critical Metrics for Digital Threads, Part 1
- Critical Metrics for Digital Threads, Part 2
- Critical Metrics for Digital Threads, Part 3
- Critical Metrics for Digital Threads, Part 4
- Critical Metrics for Digital Threads, Part 5
- Critical Metrics for Digital Threads, Part 6
- Critical Metrics for Digital Threads, Part 7
- Critical Metrics for Digital Threads, Part 8 (This Part)
- Critical Metrics for Digital Threads, Part 9