We began this blog series with the idea, captured in the notional diagram in Figure 1, that there is a connection between project management metrics such as schedule, cost, and risk; the characteristics of the digital thread; and the specific queries that a digital thread platform might make. We looked at that connection in greater detail for five different digital thread metrics categories. We illustrated these using Syndeia to make and display a variety of queries applied to a thread involving six different modeling tools and repositories. In this final post, we will look to the near future as to how these ideas will be incorporated into the next release of Syndeia.
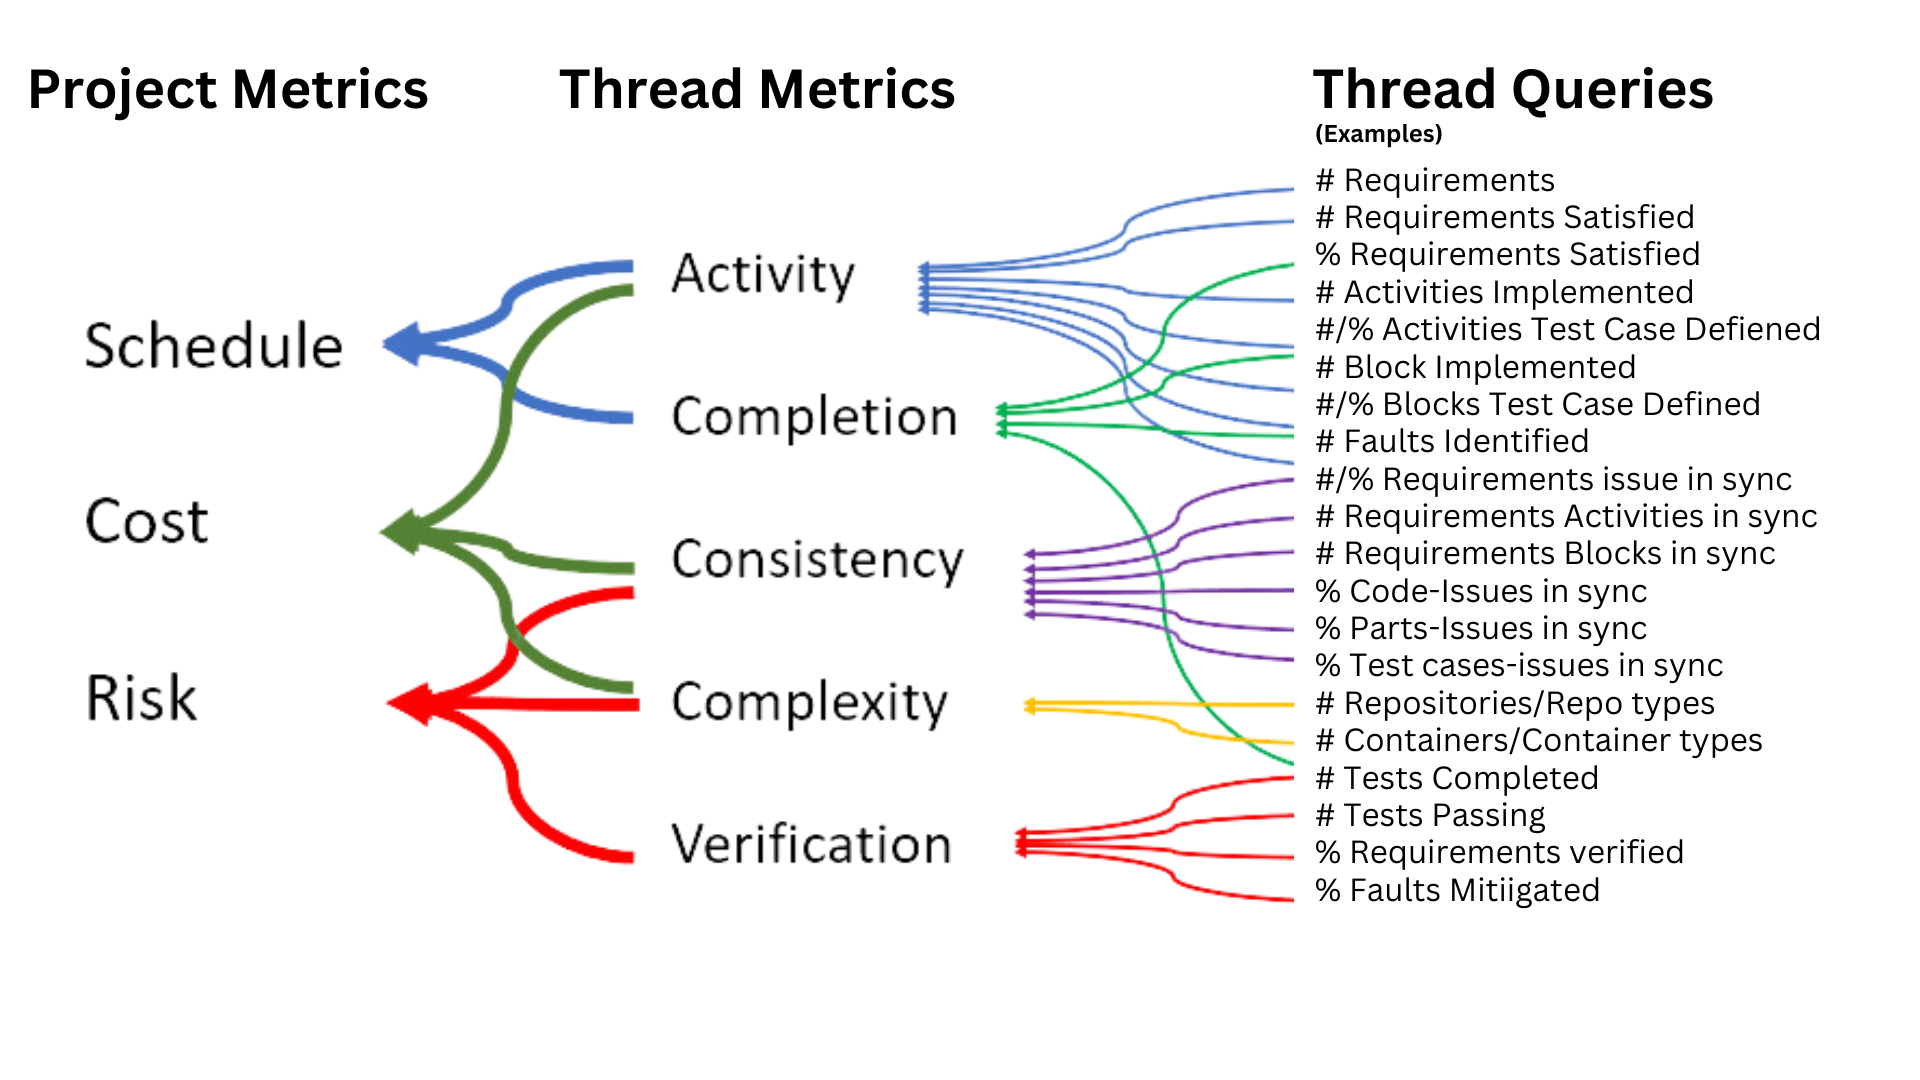 Figure 1 Decomposition of Digital Thread Critical Metrics
It will be clear to readers of this series that no definitive prescriptions of the “best” metrics were proposed. Each organization will have its own toolset, its own workflows and its own information needs. A successful digital thread platform will provide flexibility in what metrics are calculated and displayed, which is why this series has emphasized the power of an API-first approach and the use of a user-friendly interactive client, Jupyter notebooks, with a wide variety of data analysis and visualization libraries, as a low-code development and automation platform.
However, Syndeia subscriptions also provides a variety of ready-to-use clients, including a web dashboard, that already incorporate some critical metric displays. In release 3.6, available before the end of 2023, these features will be greatly expanded. While not the perfect complement for all organizations, they will provided enhanced capabilities out-of-the-box and start the internal conversation about better and more complete metrics for project development.
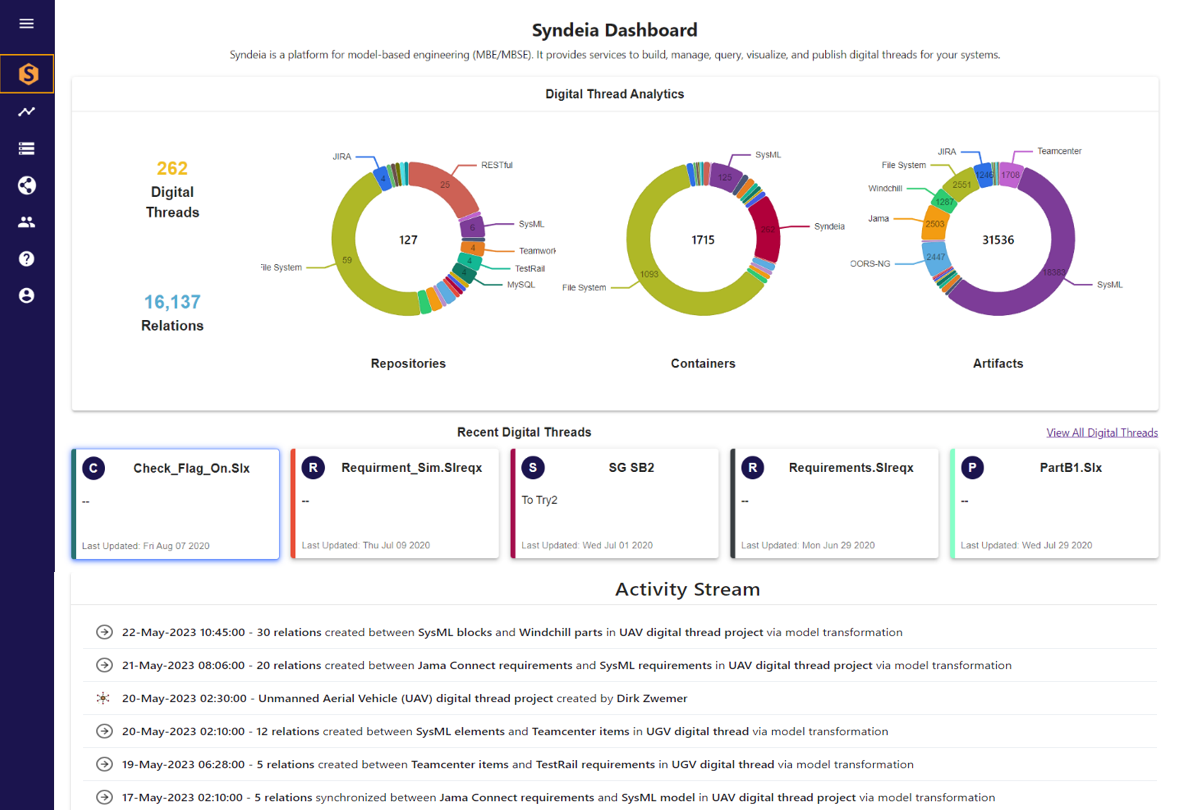 Figure 2 Global critical metrics viewed in Syndeia Web Dashboard
On first logging into the Syndeia Web Dashboard, via basic, LDAP or SSO authentication processes, users will see a set of metrics (Figure 2) for the entire Syndeia database. Repositories, containers, artifacts and relations are the basic element types for the Syndeia Cloud data model. This instance of Syndeia Cloud contains 127 different repositories holding 1715 containers holding 31,516 artifacts connected by 16,137 inter-model relations. The pie charts provide further detail about which modeling tools are represented. The majority of connected artifacts are from SysML architectural models, but PLM (Teamcenter and Windchill) and requirements (DOORS-NG and Jama Connect) models are also incorporated in significant numbers.
Any individual user, however, is more likely to be more concerned with a specific system project or digital thread than with global statistics. The Syndeia Cloud database is partitioned into Syndeia Projects or Digital Threads. In the upper left corner, Figure 2 shows that there are 262 threads available. Below the pie charts, we see the five projects most recently worked on and an activity stream listing historical development activity by project and work completed.
By clicking on the second icon on the left-hand menu, we can go to a list of all projects the user has access to. After selecting a project, a project-specific set of metrics is displayed, as in Figure 3. This project, DZSB19, is only one out of the 262 project shown in the global metrics in Figure 2, but again it provides us the total number of repositories, containers and artifacts that participate in this particular thread.
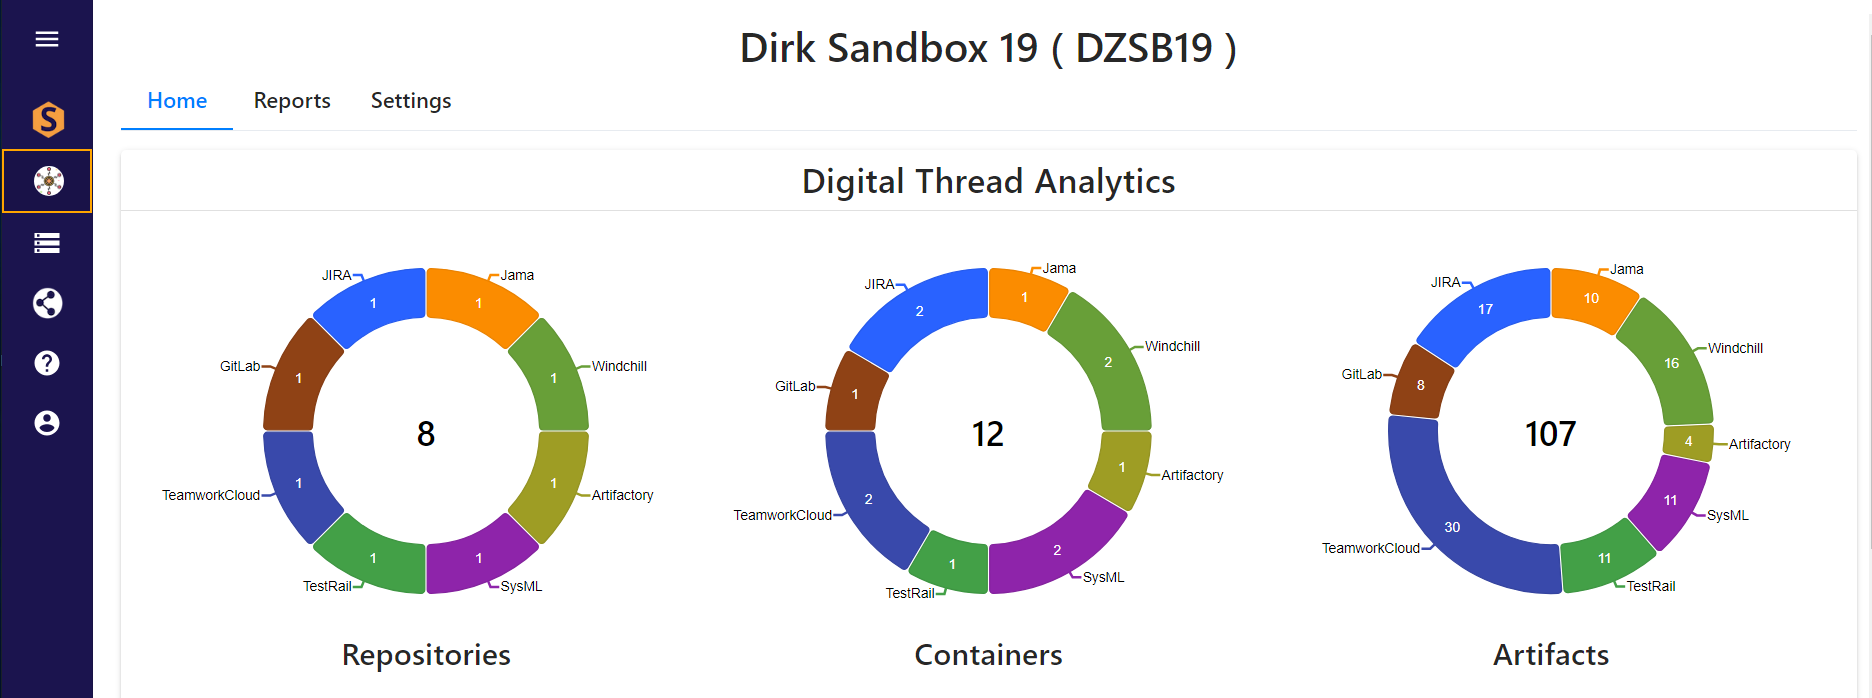 Figure 3 Project-level critical metrics viewed in Syndeia Web Dashboard
An advanced feature that will be available in Syndeia 3.6 appears under the Reports tab on this page. The user can select a specific repository type and repository and view a summary report on elements from that repository that are part of that digital thread. In Figure 4, the pie chart and underlying table report the JIRA issues that are part of project DZSB19. The data in the table includes several attributes that are not part of the data stored in Syndeia Cloud, such as status and priority. Syndeia extracts this data from the JIRA @ Intercax repository when this page is refreshed. Issues are classified by status in the pie chart and in the color coding of the table: Open, In Progress and so forth.
Similar charts are included for other common integrated repositories, including Jama and TestRail. Not all these charts may be relevant to any particular project, e.g. a project team may not use JIRA at all. This reflects the challenge of balancing the simplicity of the user experience with the wide range of information needs across multiple users. We foresee an extended period of close collaboration between Intercax and our Syndeia user base as we narrow in on the most useful standard metrics. At the same time, the Syndeia Cloud Open REST API provides a straightforward means of capturing and displaying the most specialized query results for particular customer needs.
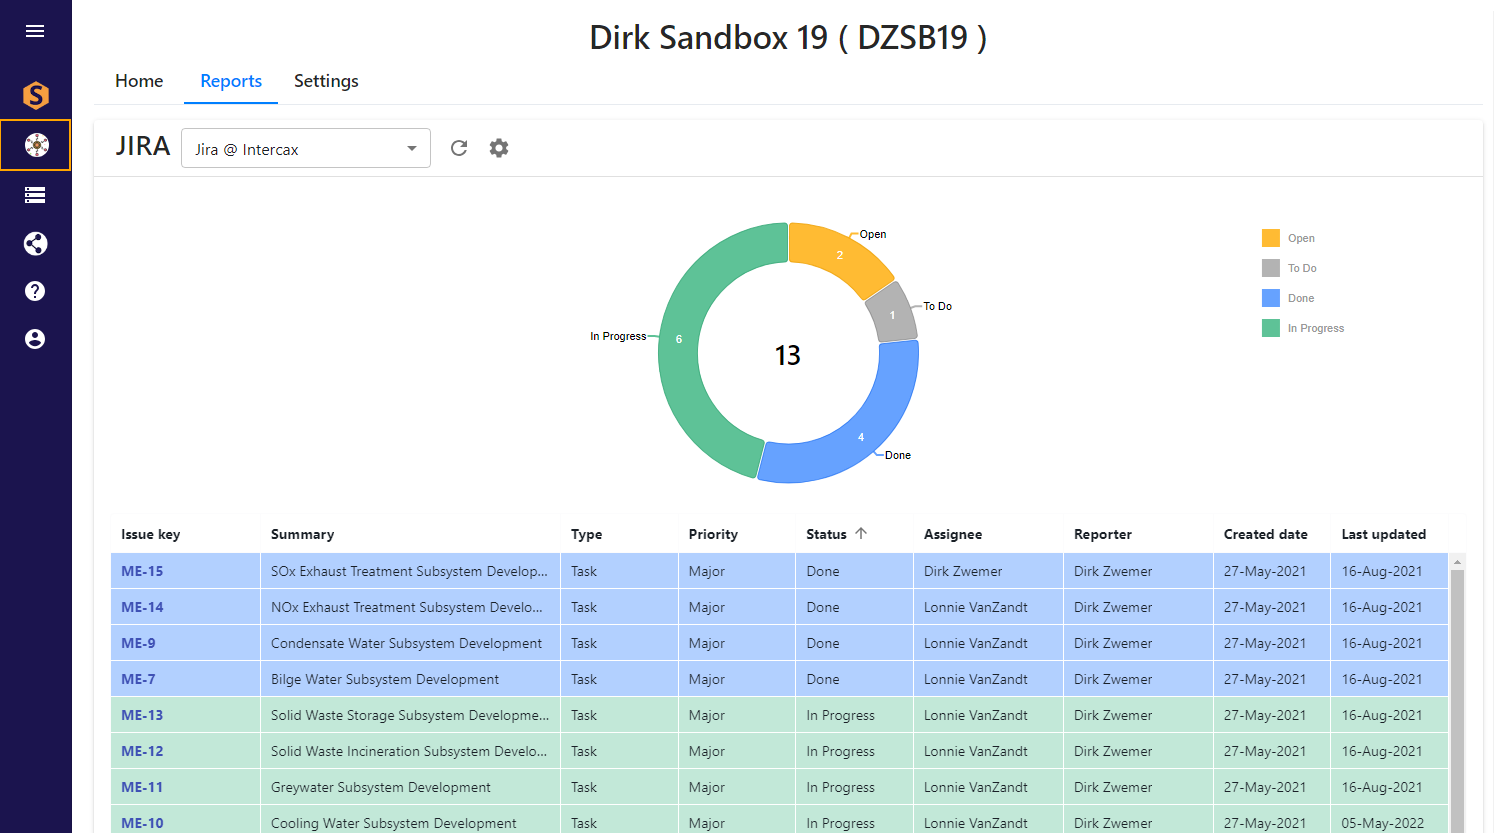 Figure 4 Model-level critical metrics viewed in Syndeia Web Dashboard
Perhaps the greatest benefit of the digital thread approach is that it provides a project team with an up-to-date holistic view of the entire system model on business- and mission-relevant timescales. But for practical reasons, projects that may contain many millions of data points must be summarized by critical metrics that are accurate, meaningful and actionable. In this series, we have introduced some of the issues that the systems engineering community will need to address.
For more blogs in the series:
- Critical Metrics for Digital Threads, Part 1
- Critical Metrics for Digital Threads, Part 2
- Critical Metrics for Digital Threads, Part 3
- Critical Metrics for Digital Threads, Part 4
- Critical Metrics for Digital Threads, Part 5
- Critical Metrics for Digital Threads, Part 6
- Critical Metrics for Digital Threads, Part 7
- Critical Metrics for Digital Threads, Part 8
- Critical Metrics for Digital Threads, Part 9 (This Part)