One great promise of Digital Threads is that project managers can obtain a concise, real-time view of the state of system development. But there have been few examples of what this would look like and how it would be derived. In particular, we need to define critical metrics that the project managers can understand and act upon promptly with minimal demand on valuable engineering time. In this blog series, we will start to examine this topic using examples from a commercial digital thread platform, Syndeia from Intercax.
We view a Digital Thread as an authoritative single source of truth about a system; see, for example, our blog series Data Science and the Digital Thread. It is a federation of the many engineering, manufacturing, quality, and other models generated during system development and production, linked by persistent connections between model elements across model boundaries. It does not aggregate all system information into a single database, but a digital thread platform can make all system information on demand through a single API.
It is this feature that makes a web-accessible project dashboard practicable. Such a dashboard, like that in Figure 1, can have multiple graphs and figures, notifications and alerts, and links to more detailed data sets. Modern web graphics libraries and business analytics platforms can provide a wide range of impressive visualization options. Still, the value of the dashboard is dependent on the validity of the underlying data and the algorithms used to condense and summarize it.
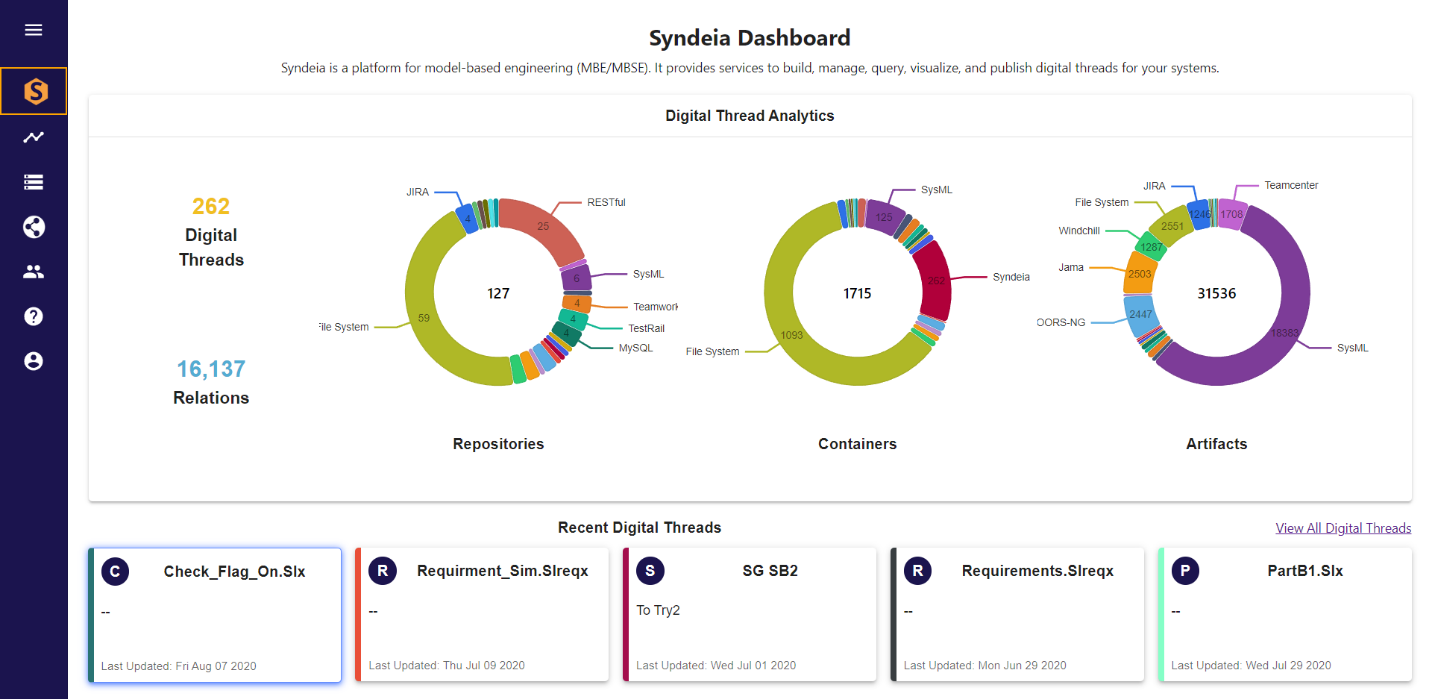 Figure 1 Sample critical metrics viewed in Syndeia Web Dashboard
This implies bridging the concerns of top management, typically related to cost, schedule, and risk against the plan, and the specific queries available through the digital thread platform, such as how many requirements are linked to test cases. One way to bridge the gap is to consider intermediate metrics applicable to the digital thread (or any digital model): complexity, activity, completion, consistency, and verification. Figure 2 shows how we might think in broad concept about these relationships, decomposing the Project Metrics (high-level concerns) through Thread Metrics (intermediate level) to individual thread queries. We will discuss and illustrate these Thread Metrics individually in later parts of this blog series.
In designing critical metrics for the digital thread, we should recognize that good metrics share some common characteristics:
- Actionable – The metric should provide clear next steps for the user.
- Timely – The metric should allow the user to act while the information is valid.
- Universal – The metric should be able to be compared from project to project.
- Secure – The metric does not expose underlying information to an unauthorized user
In the remainder of this blog series, we will explore these ideas in greater depth. Part 2 will introduce a specific digital thread and the digital tools, including Syndeia, used to generate and visualize critical metrics. Parts 3 through 7 will show specific examples of metrics for complexity, activity, completeness, consistency, and verification. In Part 8, we’ll discuss and demonstrate the automatic execution of reports, and finally, in Part 9, future steps and challenges.
For more blogs in the series:
- Critical Metrics for Digital Threads, Part 1 (This Part)
- Critical Metrics for Digital Threads, Part 2
- Critical Metrics for Digital Threads, Part 3
- Critical Metrics for Digital Threads, Part 4
- Critical Metrics for Digital Threads, Part 5
- Critical Metrics for Digital Threads, Part 6
- Critical Metrics for Digital Threads, Part 7
- Critical Metrics for Digital Threads, Part 8
- Critical Metrics for Digital Threads, Part 9