Skip to main content
Why Intercax
For Executives
Transform your digital engineering strategy
For Digital Engineers
Experience the power of digital threads
For IT Admins
Leverage a single, secure platform for enterprise digital engineering
For Partners
Join us to shape the future of digital engineering
Show submenu for Products
Products
Show submenu for
Syndeia®
Digital Thread Platform
Syndeia®
Digital Thread Platform
What is Syndeia®?
Syndeia Demonstrations
Syndeia 3.6 New Features
Syndeia Integrations
Syndeia Documentation
Syndeia Brochure
Syndeia Download
Syndeia FAQs
ParaMagic
SysML Parametric Solver
Services
Syndeia Training Program
Live, instructor-led Syndeia training
Syndeia Advanced Support
Digital thread guidance and IT support
Digital Engineering Projects
Digital engineering solutions for your organization
Solutions
Aerospace
Digital threads for spacecrafts, satellites, and UAVs
Defense
Digital threads for mission engineering
Automotive
Digital threads for autonomous vehicles
Healthcare
Digital threads for medical devices and healthcare systems
Energy
Digital threads for energy generation & distribution systems
Manufacturing
Digital threads for smart manufacturing
Electronics, IT, and IoT
Digital threads for cyberphysical systems
Show submenu for News
News
Show submenu for
Conferences
Meet our team at events
Conferences
Meet our team at events
Conference & Event Schedule
Digital Thread Conference 2025
Newsletters
Monthly news to your mailbox
Blog
New digital thread stories
About Us
Who We Are
Discover our story
Leadership
Meet our leadership team
Careers
Career Opportunities
Partnerships
Partners and Partnership Program
Contact Us
Get in touch
Open main navigation
Close main navigation
Show submenu for Why Intercax
Why Intercax
Why Intercax
For Executives
For Digital Engineers
For IT Admins
For Partners
Show submenu for Products
Products
Products
Show submenu for Syndeia®
Syndeia®
Syndeia®
What is Syndeia?
Demonstration
Syndeia 3.6 New Features
Syndeia Integration
Digital Thread Quick Course
Syndeia Documentation
Syndeia Brochure
Syndeia Download
Syndeia FAQs
ParaMagic
Show submenu for Services
Services
Services
Syndeia Training Program
Syndeia Advanced Support
Digital Engineering Projects
Show submenu for Solutions
Solutions
Solutions
Aerospace
Defense
Automotive
Healthcare
Energy
Manufacturing
Electronics, IT, and IoT
Show submenu for News
News
News
Show submenu for Conferences
Conferences
Conferences
Conference & Event Schedule
Digital Thread Conference 2025
Newsletters
Blog
Show submenu for About Us
About Us
About Us
Who We Are
Leadership
Careers
Partnerships
Contact Us
Search
Contact Us
Contact Us
Search
Intercax
Blog
Our mission is to enable solutions for designing complex systems on time, on budget and with first-time quality.
May 26, 2025
•
2 min read
Fast-Track Digital Thread Training
March 06, 2025
•
1 min read
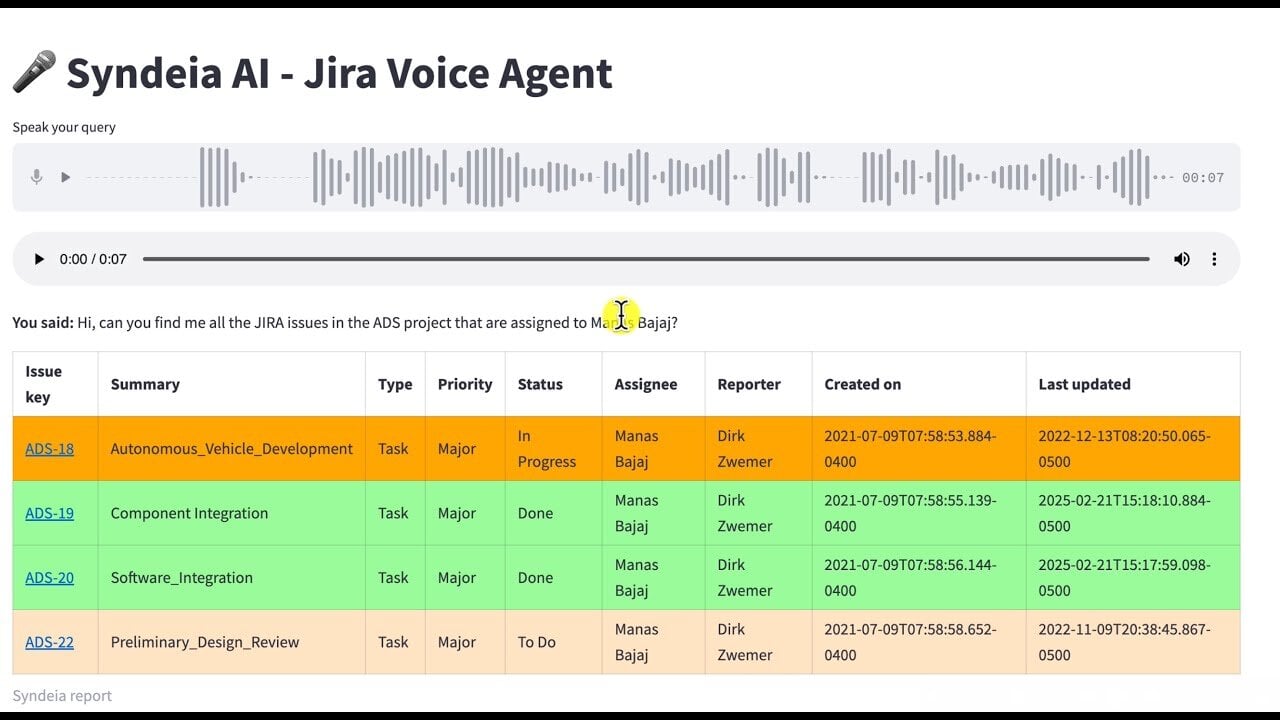
Syndeia AI - Jira Agent, Part 3
March 04, 2025
•
1 min read
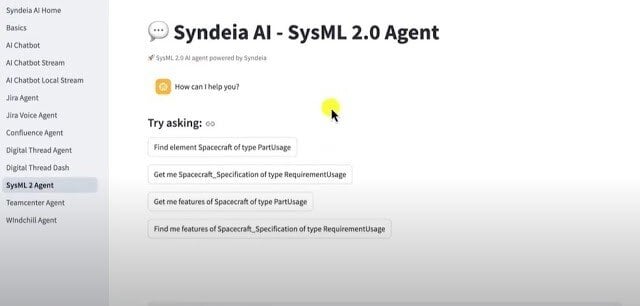
Syndeia AI - SysML 2.0 Agent, Part 2
February 05, 2025
•
1 min read
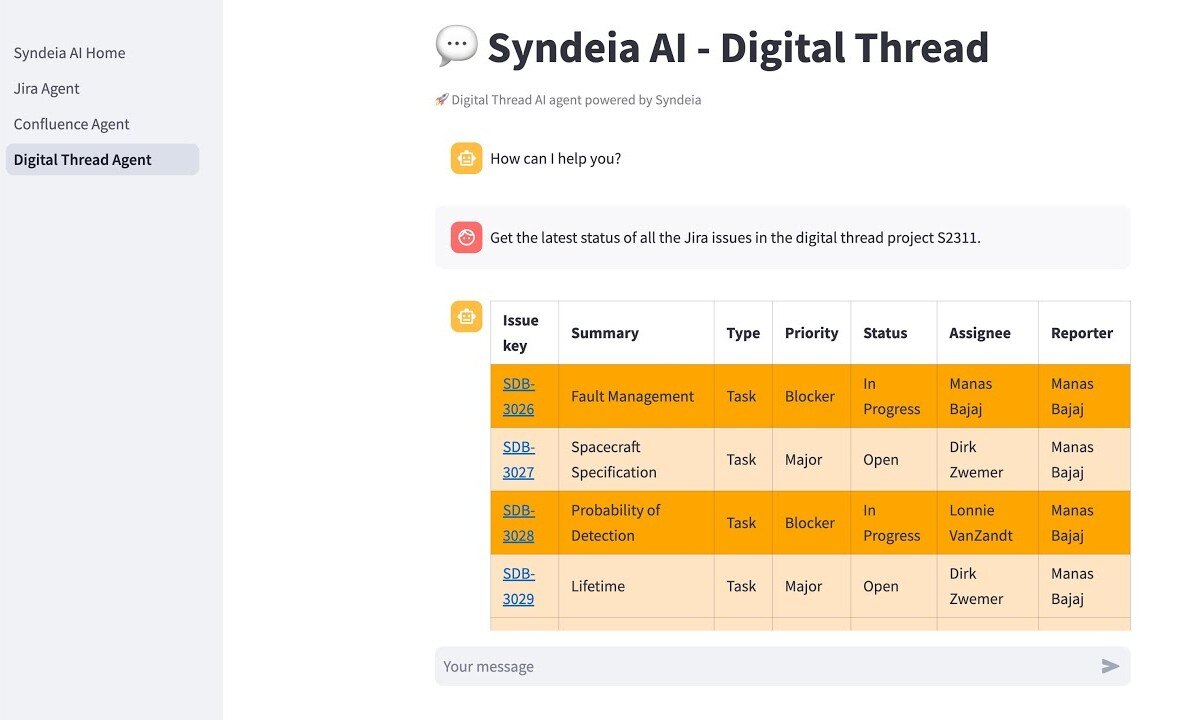
Syndeia AI Agents, Part 1
January 15, 2025
•
6 min read
Santa’s Mission 2024 with 8.2 billion landings made possible by Digital Threads (Day 5)
January 15, 2025
•
3 min read
SDS Hardware, Software, and Verification Digital Threads go live (Day 4)
January 15, 2025
•
4 min read
3D Sleigh Assembly model coordinated with System Architecture (Day 3)
January 15, 2025
•
7 min read
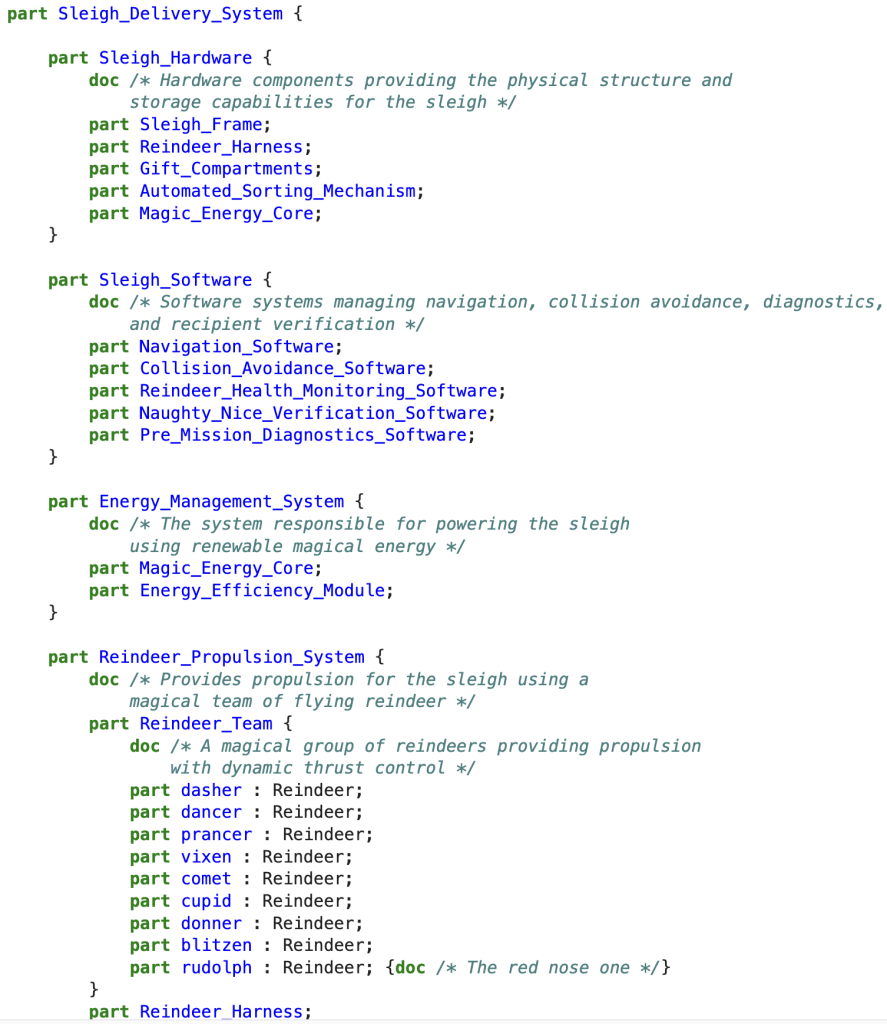
Sleigh Delivery System – Architecture & Digital Thread Dashboard (Day 2)
January 15, 2025
•
3 min read
North Pole Calls Intercax for Digital Mission Possible (Day 1)
January 15, 2025
•
2 min read
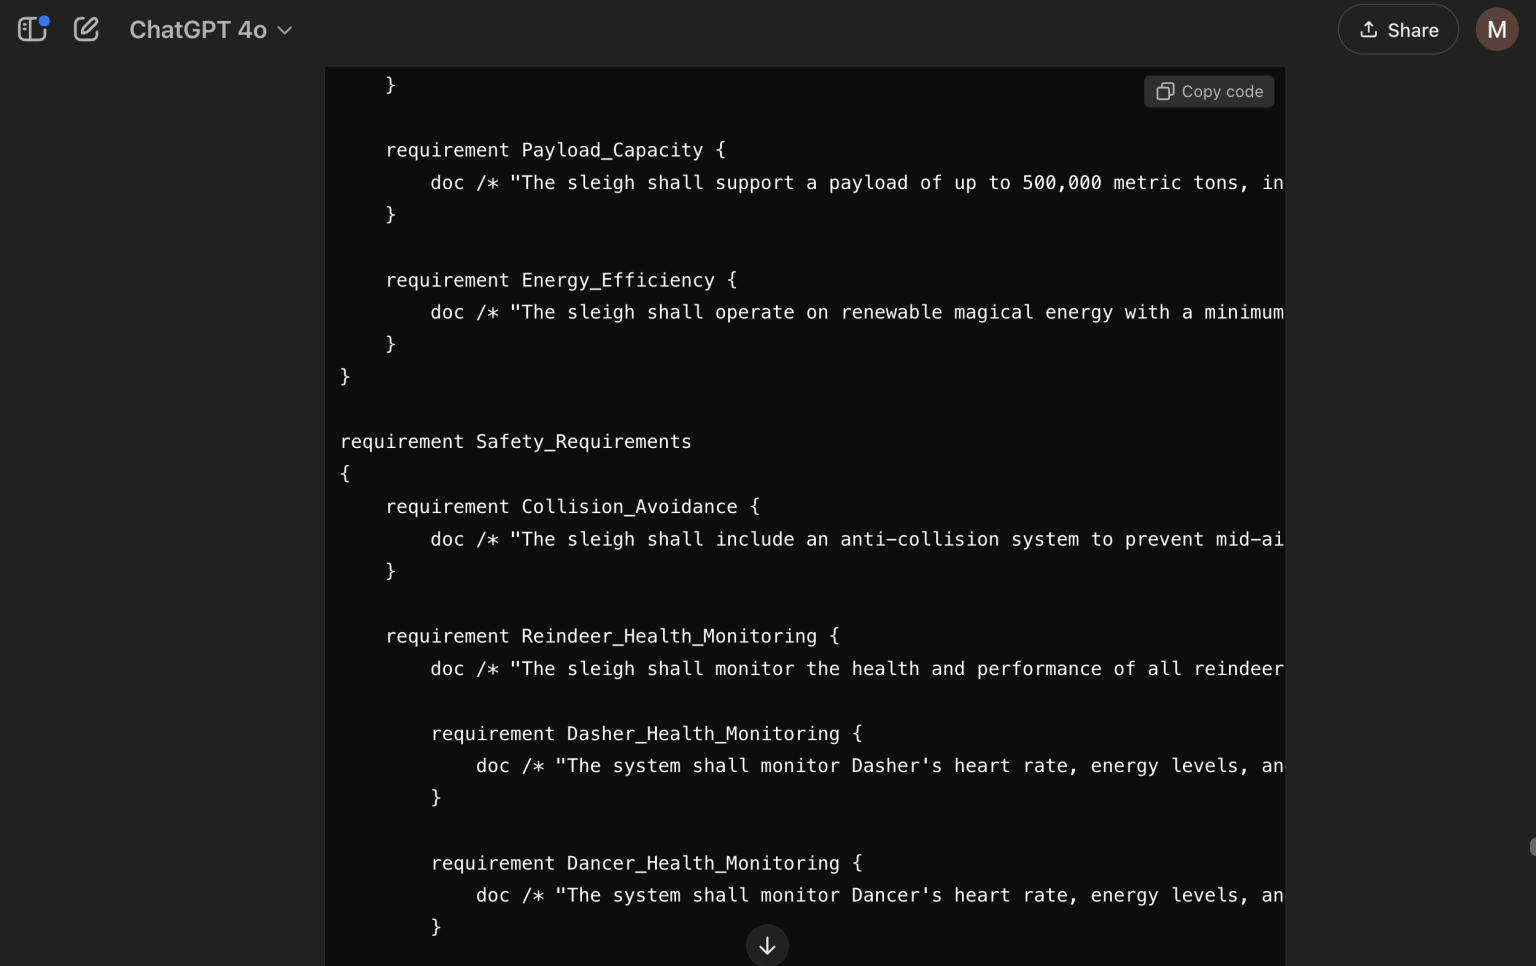
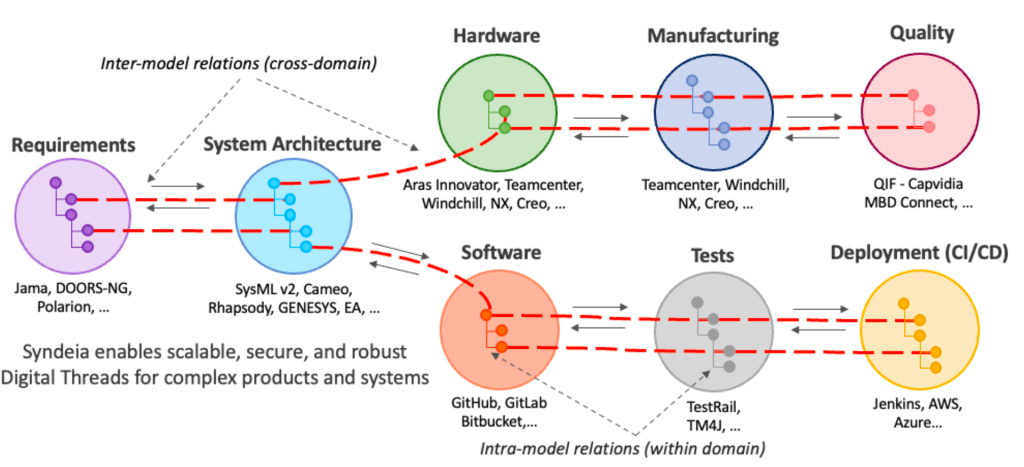
SysML v2 and Digital Threads with Syndeia
January 15, 2025
•
3 min read
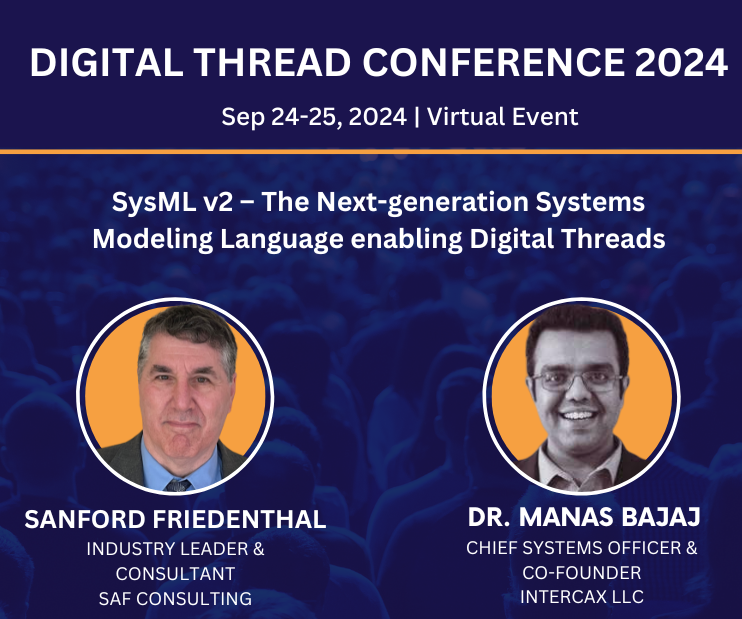
Digital Thread Conference 2024: A Milestone for Digital Engineering
December 11, 2024
•
8 min read
AI for DT & DE | Part 1 – Connecting with OpenAI as a service in Syndeia®
1
2
3
4
5
All
Next
Ready to start your
Digital Thread
journey?
Take the first step in your transformation
Explore Demos
Contact Us