Part 1 and Part 2 of this blog series have focused on the SysML models of energy systems (and system-of-systems). In this part (Part 3), we will describe the MBE graphs created when the SysML-based architecture model is connected with discipline-specific models such as CAD models, simulation models, PLM models, requirements model of energy system (or system-of-systems). In particular, we will focus on how to visualize and query the graphs, with the ultimate objective of identifying connections that throw light on the reliability or resilience of the system.
As the number of connections grows, our ability to understand the scope and complexity of the total system model (TSM) and to identify extended linkages between elements diminishes. We need to be able to view the system model globally and to trace connections locally. Syndeia 3.0 offers the energy industry both.
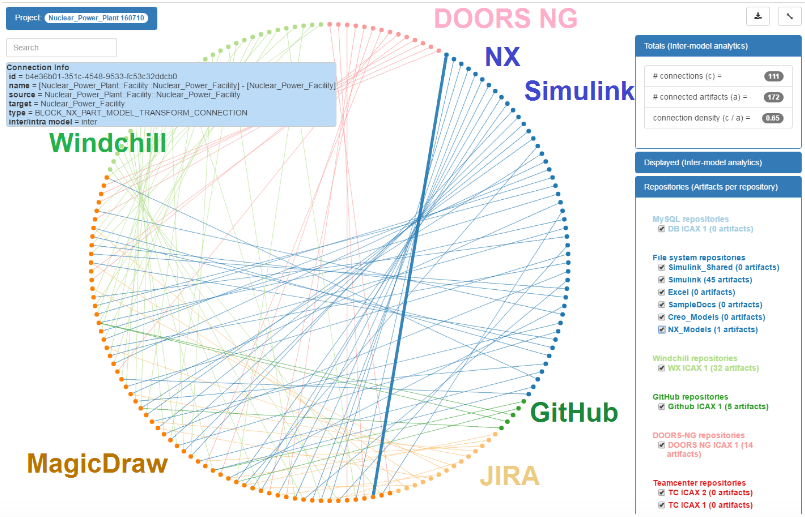
Figure 1 Chord plot of Inter-model Connections – Global Visualization
Figure 1 shows a global view of the inter-model connections in a chord plot. The upper right box reports that 172 elements are connected by 111 Syndeia-managed connections. The elements on the periphery of the circle represent SysML (orange), PTC Windchill (green), DOORS NG (pink), Simulink and NX (blue), GitHub (green) and JIRA (beige) elements. The nodes and the lines between them can be interactively highlighted and identified in the light blue box on the upper right, and the entire plot can be searched and filtered. Using this, the system engineer can see at a glance the types of elements being connected and the density of connections in the current state of the model.
While the global view in Figure 1 gives the big picture, many use cases involve tracing extended linkages over both inter-model and intra-model connections. Alternate graphing techniques can make this task simpler. One example is shown in Figure 2, a tree plot initiated from a specific SysML model element in the SysML tool or the Syndeia dashboard. Launched from a SysML activity, Generate Electricity, it immediately displays five nearest neighbors, a JIRA issue and a Simulink block connected by inter-model connections (shown in black) and three SysML sub-activities connected by intra-model connections (shown in orange). One of these last nodes can be further expanded by clicking on it, showing an additional seven next nearest neighbors and the process can be continued selectively until the chain is terminated. In the resulting plot, the extended linkage between the DOORS requirement at the far right, the SysML function it impacts, and the JIRA issue that records that impact, is traced over seven connections across three tools. Consider the value of these approaches in expediting design reviews, with explicit connections between system elements and the ability to open those elements in their native tools from a central high-level roadmap of the system.
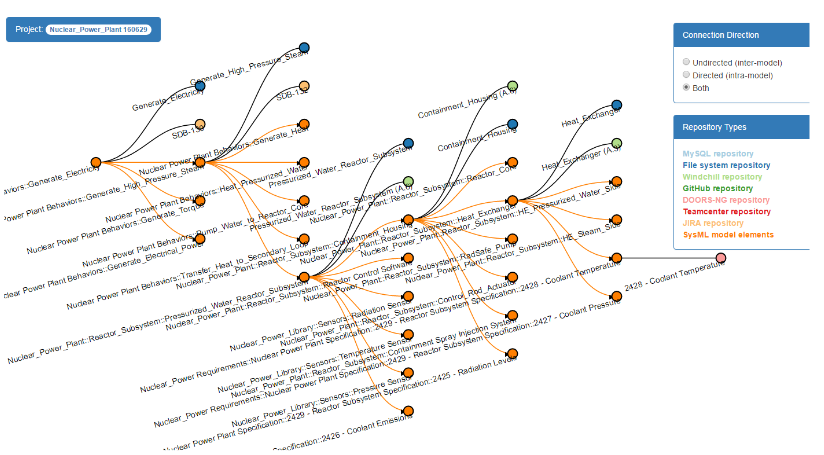
Figure 2 Tree plot of Inter-model and Intra-model Connections demonstrating traceability across graph
Ultimately, systems engineering must embrace the full power of modern graph databases and query languages, as social networking sites have. We need to identify specific chains of connections across multiple tools, quickly and efficiently, in graphs with millions of elements.
In prototype work for the next generation of Syndeia, Intercax is investigating the possibilities. In the examples below, we have exported both the inter-model connections between tools managed by Syndeia and the intra-model connections inside the SysML model into a Neo4j database where they can be explored using Cypher, a powerful graph query language.
In Figure 3, we have asked the graph database to show all requirements satisfied by the Nuclear Power Plant block or its parts to the third level of decomposition. The SysML blocks are purple, starting from the left edge and connected by part property relationships, while the SysML requirements are yellow, connected to blocks by <> relationships.

Figure 3 Query: Show all the SysML requirements the Nuclear Power Plant block or its parts must satisfy directly
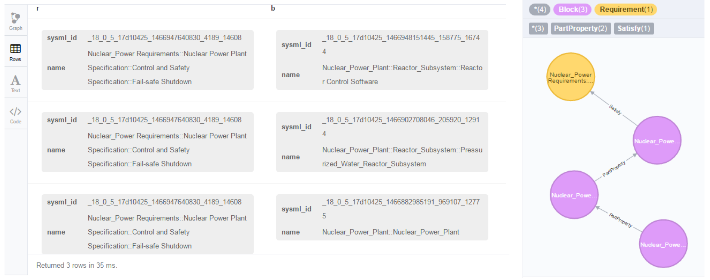
Figure 4 Query: Show me all the SysML blocks affected by Fail-Safe Shutdown requirement
Figure 4 asks for all blocks impacted by the Fail-Safe Shutdown requirements. The results, shown in both tabular and graphical format, identify three, starting with Reactor Control Software and extending up the hierarchy to the Nuclear Power Plant.
Figure 5 asks the database to search for all chains, of any length, between a specific GitHub file and a specific DOORS requirement. One is identified, involving two intermediate SysML elements.
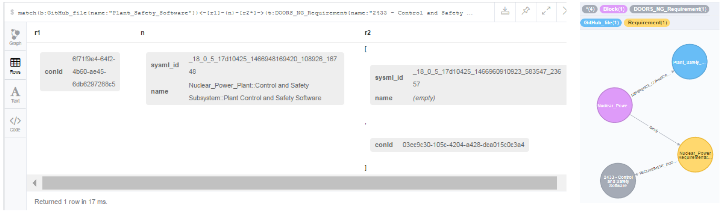
Figure 5 Query: Is GitHub file “Plant_Safety_Software” connected to DOORS requirement “2433 - Control and Safety Software”?
The ability to search for extended connections across the Total System Model will have a major impact on identifying system vulnerabilities and failure mechanisms, leading to safer and more resilient energy systems. As such concerns are the shared responsibility of utilities, suppliers, regulators and others, these capabilities must also be available on a true enterprise basis, crossing organizational and discipline boundaries. Intercax, working with many other innovators, is working to make this a reality.
Download:
SysML Models – Nuclear_Power_Plant_Example | Nuclear_Plant_Example.eap | Regional_Energy_Model_RHP
Technote PDF – Application of MBE to Energy Engineering
Related posts:
- MBE for the Energy Industry | Part 1
- MBE for the Energy Industry | Part 2
- MBE for the Energy Industry | Part 3 (this post)