In Part 1 of this series, we explored how Syndeia 3.0 generates global displays of connections between various engineering software tools. While these global displays (e.g. Figure 1) provide a snapshot of graph complexity, some very important use cases require us to trace out chains of individual connections and identify those model elements that may impact us, or that we may impact. For example, as a requirements manager, I may need to search for which mechanical designs will be impacted by a change in one of my requirements. Conversely, as a mechanical designer, I need to know exactly what are the requirements governing my design.
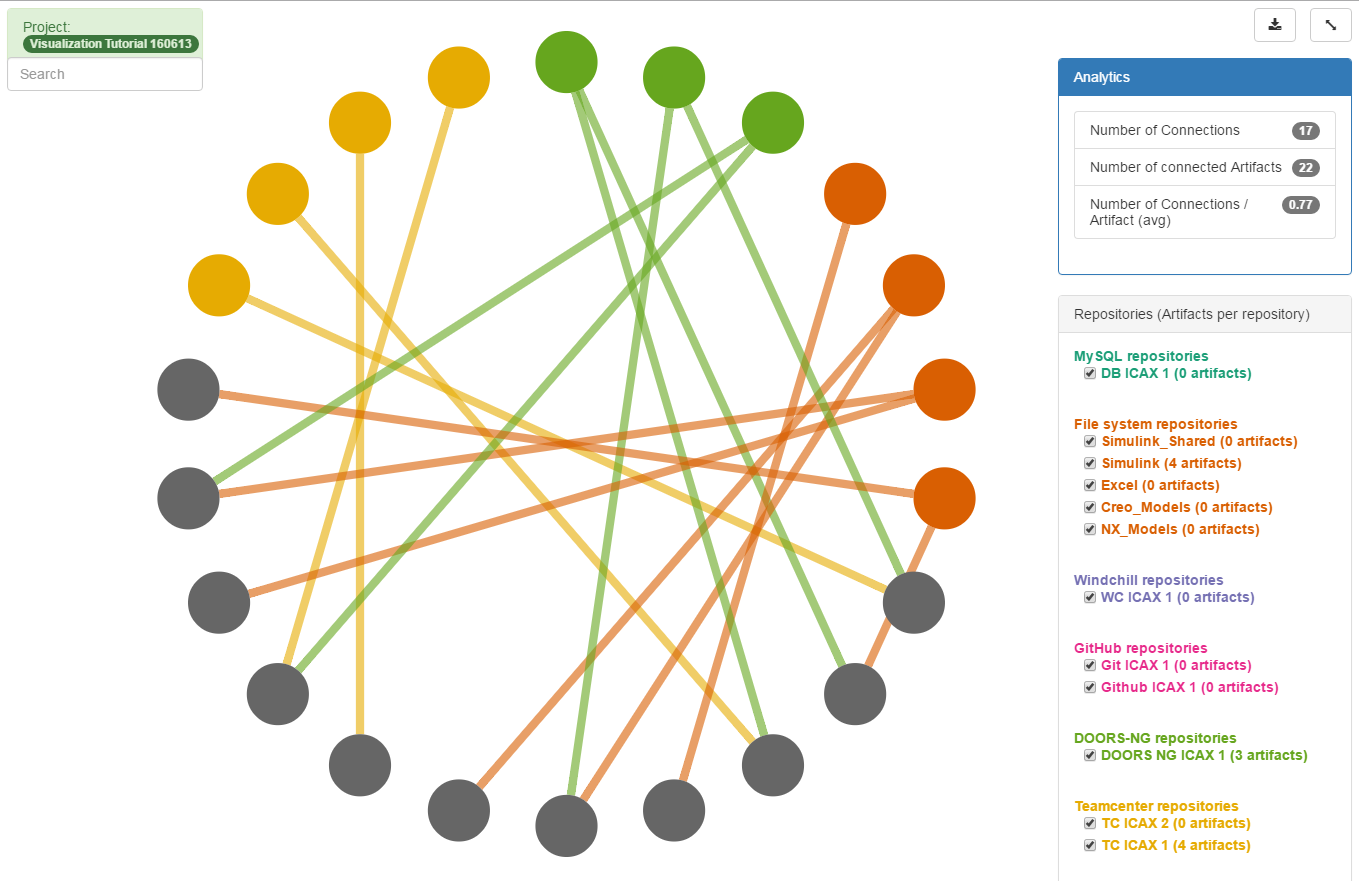
Figure 1: Syndeia Global Visualization graph
For these use cases, Syndeia provides two Local Visualization options. If we right-click on any element in the SysML model (Syndeia browser or SysML diagram) or the Syndeia dashboard and select Syndeia → Visualize → View Neighboring Artifacts – Tree Layout, a diagram such as Figure 2 appears in the default web browser. In this case, using the same model as described in Part 1, we started from the SysML block Visualization::Payload in a MagicDraw model. It appears with the two elements it is connected to, a Teamcenter item (008675/A;1-Payload) and a DOORS NG requirement (2084 - UAV_Payload_ Specification). In the same graph, we can click on the second node and expand to show its additional connections, and then repeat the process to show the further links, as shown in Figure 3.
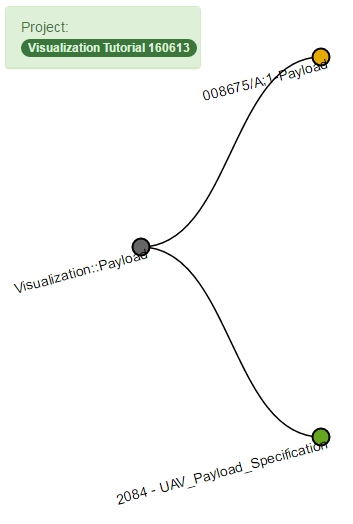 Figure 2: Syndeia Local Visualization, Tree Layout option, beginning from SysML block Payload
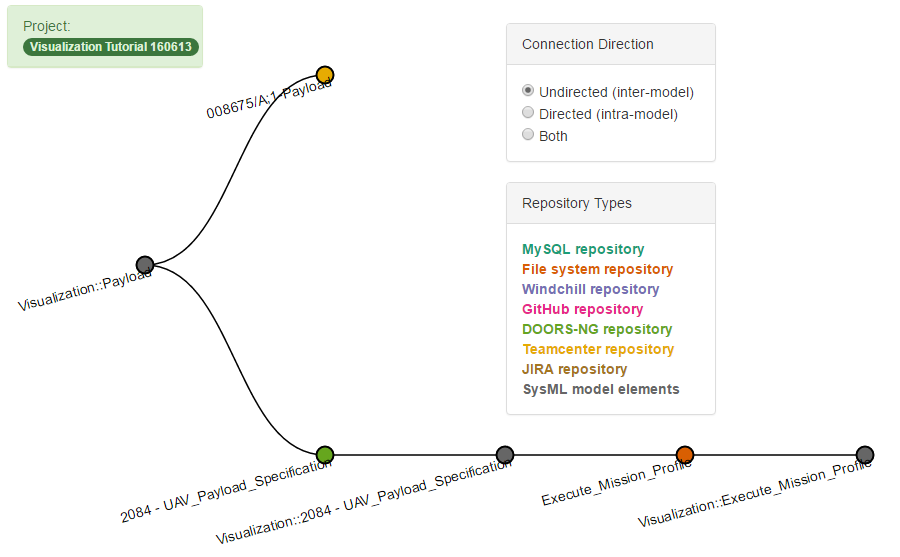 Figure 3: Syndeia Local Visualization, Tree Layout option, beginning from SysML block Payload and expanding from DOORS NG Requirement 2084- UAV_Payload_Specification
The tree layout in Figure 2 and Figure 3 has an important limitation; as a simple tree, it cannot show cyclic or cross-cutting relationships. An alternative display format, Auto Layout, as shown in Figure 4, uses the same starting point (Visualization::Payload). It can show cyclic connections, such as the uppermost link shown between Teamcenter item (008675/A;1-Payload) and SysML activity (Visualization::Execute_Mission_Profile), which could not be shown in Figure 3.
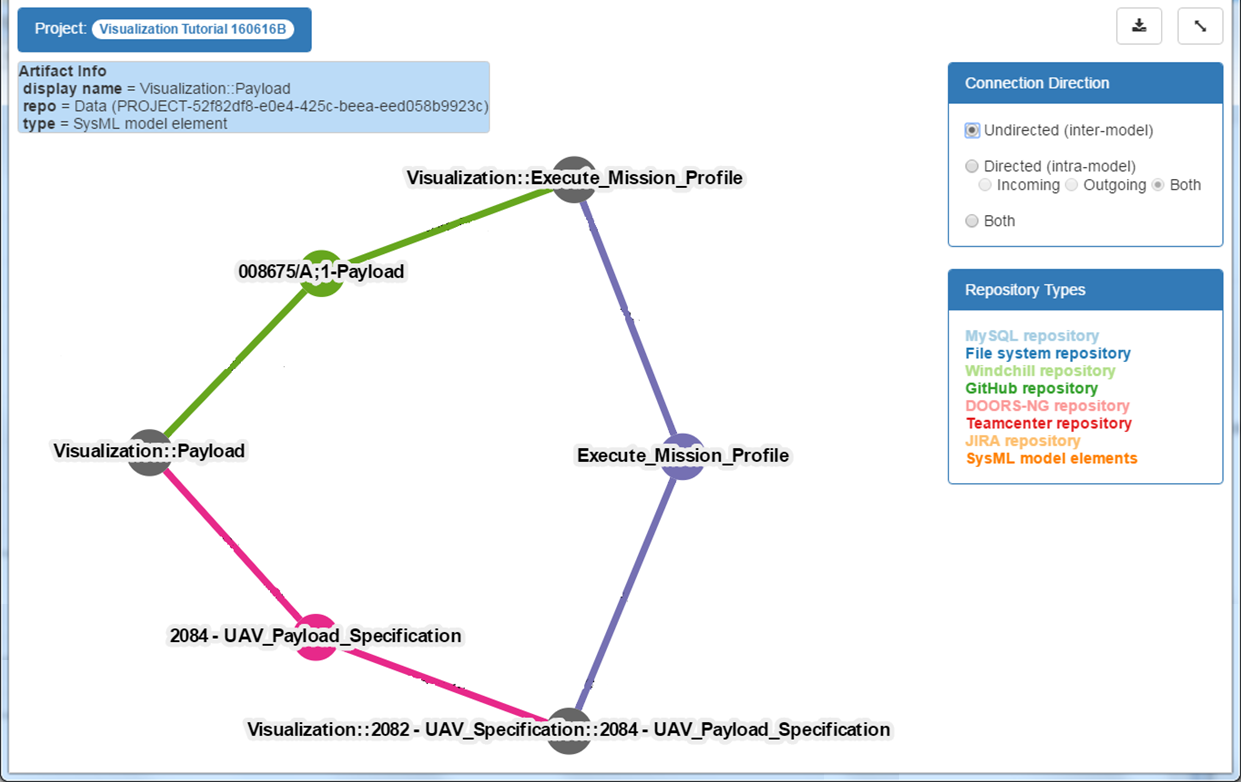 Figure 4: Syndeia Local Visualization, Auto-Layout option, showing cyclic relationship graph
In Figures 2, 3 and 4, we have chosen to show only inter-model connections, but a complete picture of the total system model (TSM) needs to include the connections between elements inside the model – for example, compositional and dependency relationships in the SysML model. In Part 3, we will look at how Syndeia can display these intra-model connections.
Related blog posts:
- Visualizing Syndeia Connections, Part 1
- Visualizing Syndeia Connections, Part 2 (this page)
- Visualizing Syndeia Connections, Part 3