As part of the release of Syndeia 3.6, we are publishing a series of blog posts highlighting the new features supporting practical implementation of digital threads in system development.
One of the primary benefits of the digital thread is that it organizes system data from many different sources and makes it available in near real-time for project management purposes. This minimizes the need for data gathering, report writing and lengthy meetings simply to keep program leaders up-to-date on issues affecting cost, schedule and risk.
The ability to do this is intrinsic to the Syndeia Cloud REST API and can be accomplished through a variety of business analytics and data science platforms used as Syndeia clients, providing custom digital engineering solutions for organizations. As an example of these capabilities, Syndeia 3.6 has added a Reports tab to the Digital Thread Project (DTP) Dashboard in the Syndeia Web Browser, provided as part of a Syndeia annual subscription.
Reports Tab
After a DTP has been selected, the Reports tab is visible in the top menu bar. When opened, the first two tables provide flat lists of the Repositories and Containers connected into the active DTP. These represent the underlying data sources from which at least one data artifact has an inter-model relation joining it in this project.

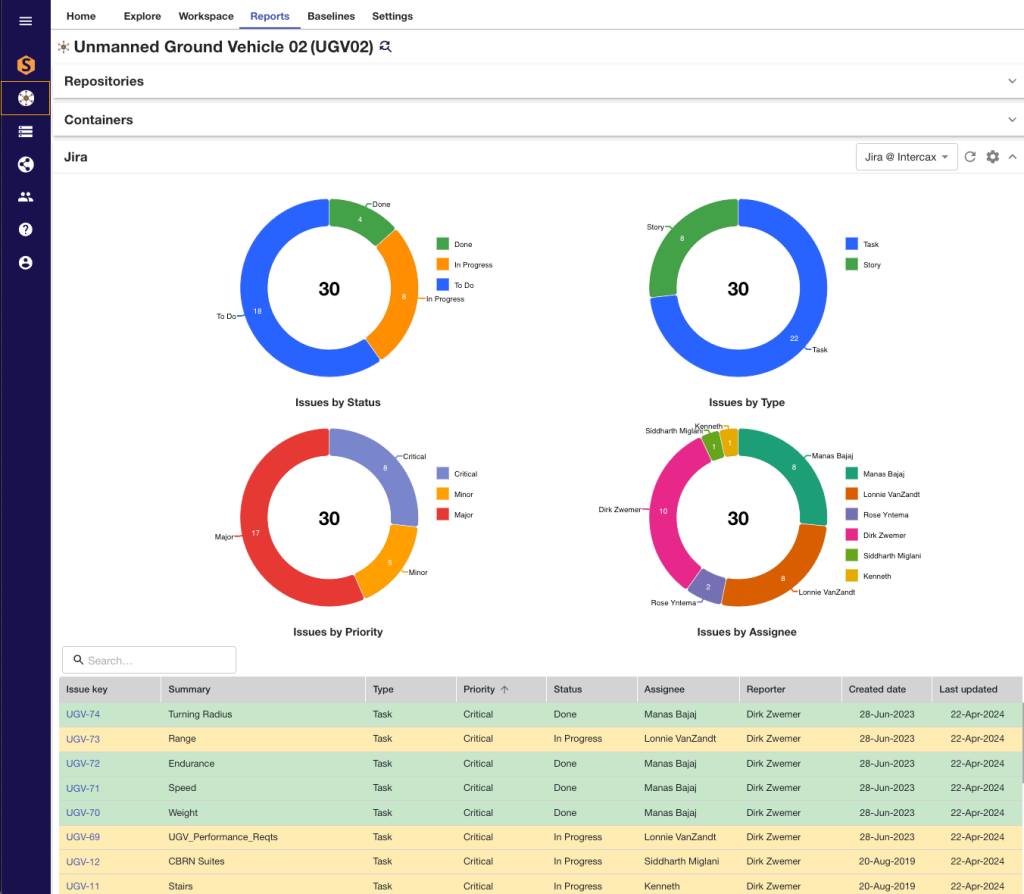
Below these two tables is a dashboard of JIRA artifacts participating in the active DTP, refreshed directly from the JIRA repositories when the page is opened or the Refresh icon is clicked. This analyzes the JIRA issues connected to project with respect to four attributes: status, priority, issue type and assignee. In Figure 1 we see the data displayed as four pie charts and a tabular digest below. This data is not normally stored in Syndeia Cloud; it is extracted on demand from the JIRA repository.
This report answers a wide variety of pertinent questions, including
- How many issues are open? How many done?
- How critical are these issues?
- Are they bugs, tasks, new features or something else?
- Who’s working on them?
all information now freshly available to the project lead with additional human effort.

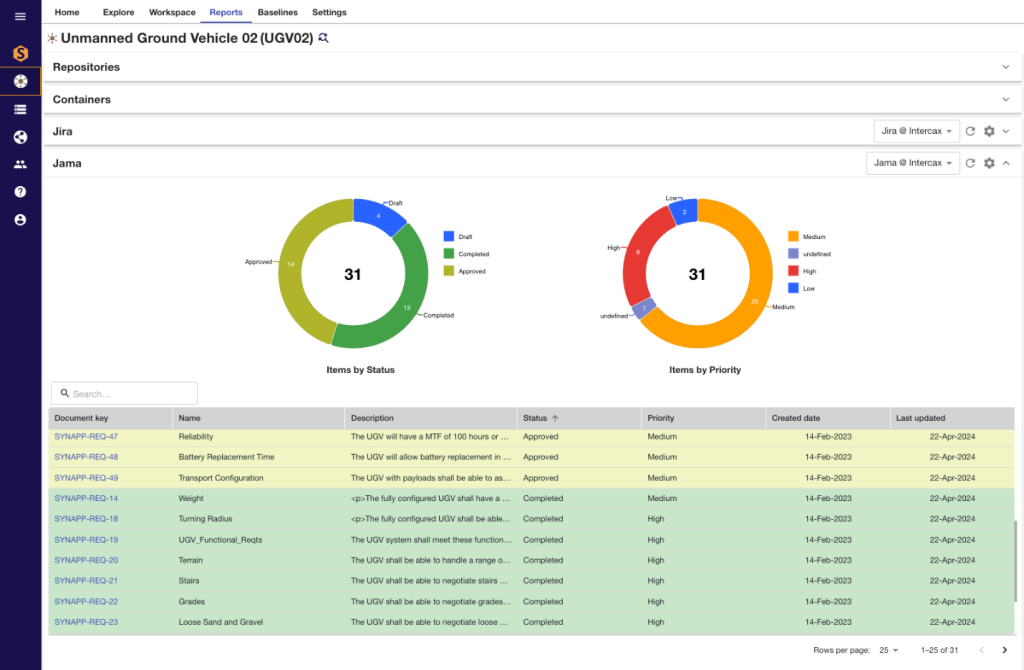
A second set of reports is available for any Jama Connect requirements repositories participating in the active DTP (Figure 2). In this case, only two attributes, Status and Priority, are analyzed.
Syndeia offers integrations to 30 different engineering software tools, plus a much, much larger range through the generic RESTful API capabilities, but in the 3.6 release, only two are currently included under the Reports tab. Users should consider this feature as a placeholder to be expanded in future releases as customer feedback identifies analyses of general interest and as an illustration of Syndeia’s capabilities that can be exploited by the user through their own custom interfaces, scripts and Jupyter notebooks.
There are additional reporting and analysis capabilities introduced in 3.6. In Part 6, we will decribe an important new feature, graph query libraries.
Other parts in this series:
- Syndeia 3.6 Release, Part 1: Digital Thread Project Security
- Syndeia 3.6 Release, Part 2: Digital Thread Project Privileges
- Syndeia 3.6 Release, Part 3: Digital Thread Project Dashboard
- Syndeia 3.6 Release, Part 4: Digital Thread Project Browsing
- Syndeia 3.6 Release, Part 5: Digital Thread Project Reports (This Post)
- Syndeia 3.6 Release, Part 6: Digital Thread Project Graph Query Libraries
- Syndeia 3.6 Release, Part 7: Digital Thread Project Baselines
- Syndeia 3.6 Release, Part 8: New Integrations
- Syndeia 3.6 Release, Part 9: Integration Enhancements
- Syndeia 3.6 Release, Part 10: Infrastructure and a Look Forward
 Intercax
 Intercax